Methodology
This research focused on how climate change would affect crops and water availability for irrigation, and the potential of different adaption technologies to reduce the negative effects of climate change.
A combination of different models and statistical analyses was used. Historical climate datasets and future climate projections from global climate models (GCMs) provided input data for the crop and hydrological modeling. The hydrological model was also informed by crop modeling results of water requirements for irrigation. Calculations of future water consumption for irrigation, domestic and other uses were informed by population projections and land cover modeling. Household survey data and focus groups provided information on agricultural and water management practices. Figure 1 below provides an overview of the coupled modeling approach and the datasets used in the analyses.
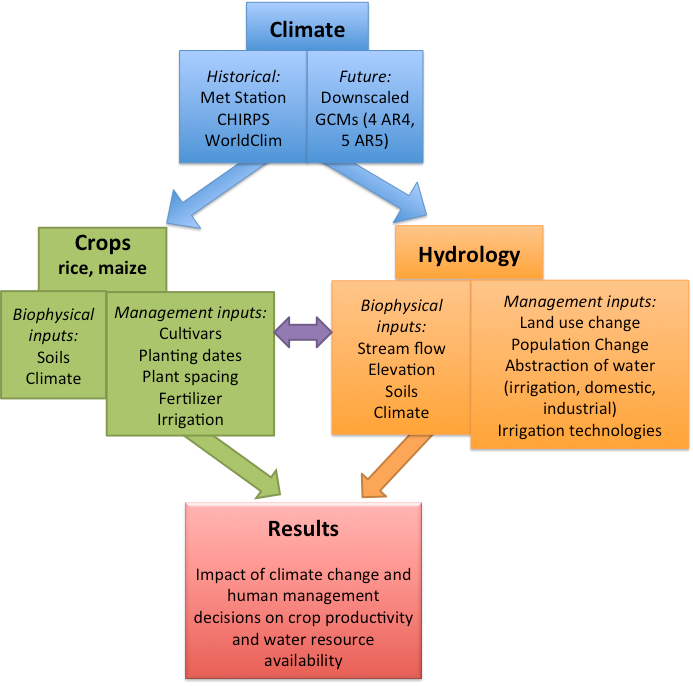
The coupled modeling approach and datasets used. Source: Olson et al. 2015.
The analysis was thus conducted using four types of models (climate, crop, hydrological and land use) and statistical analysis. Calibration of the models to local, observed or measured data was conducted as much as possible. However, the calibration and validation of the models was hampered by the limited amount of observed data available. Because of this, the results should be considered indicative and should not be interpreted as certain. The model results will be refined as additional data and information is incorporated.
Climate Analysis and Modeling Methodology
Historical, or recent, climate datasets were used to examine observed trends in precipitation, to calibrate the crop and the hydrological models, and as inputs to the crop and hydrological models (Moore et al. 2012). The historical climate dataset used in these analyses include:
- Observed meteorological station data from the Tanzania Meteorological Agency. 17 stations that had sufficient length and quality of precipitation in the Rufiji Basin were selected for precipitation analysis and to run in the crop model.
- WorldClim (Hijmans et al., 2005) which represents current climatic conditions. It is a spatial dataset with monthly means covering the period 1960–1990. To obtain daily data for the 30 year period for the crop model, we used the weather generator MarkSim (Jones and Thornton 2000).
- CHIRPS (Climate Hazards Group InfraRed Precipitation with Station data, Funk et al. 2014) version 1.8. CHIRPS is a high-resolution, daily time series, spatial precipitation dataset from FEWSNET/UCSB covering the period 1983 to 2014.
- NASA Power (NASA 2014) is a satellite-derived spatial, time-series product. NASA Power’s minimum and maximum temperatures, and solar radiation variables were used in the crop and hydrological models.
Global Climate Models (GCMs) provided future climate simulation results. The Intergovernmental Panel on Climate Change (IPCC) has endorsed new AR5 models that are considered an improvement over the AR4 models. However, because of the inherent uncertainty of future climate change and Global Climate Modelling, the results should be considered indicative and should not be interpreted as certain. Four AR5 models were selected for the Rufiji Basin region based on their ability to simulate observed spatial and temporal climate trends (Otieno and Anyah (2013), and to provide a level of comparison between GCMs. The simulations are from the high or runaway (RCP8.5) Representative Concentration Pathways (RCPs) or levels of greenhouse emissions. The GCMs selected and whose simulations are represented in this report are:1
- CCSM4: Community Climate System Model, version 4 from the National Centers for Environmental Research, National Center of Atmospheric Research, USA,
- MPI-ESM-LR: Max Planck Institut für Meteorologie Earth System Model, Germany,
- CanESM2: The Canadian Centre for Climate Modelling and Analysis Earth System Model, version 2,
- MRI-CGCM3: Meteorological Research Institute, Japan.
The data were downscaled to 6 km and bias-corrected to daily time steps using a MATLAB program (http://globalclimatedata.org/) and modified to suit our needs. Historical data sources were based on CHIRPS v 1.8 for rainfall data and interpolated daily station data for historical temperature surfaces done for the hydrological modeling. Monthly perturbations were applied to daily time series for the years 2010-2060.
1. We acknowledge the World Climate Research Programme's Working Group on Coupled Modelling, which is responsible for CMIP, and we thank the climate modeling groups for producing and making available their model output. For CMIP the U.S. Department of Energy's Program for Climate Model Diagnosis and Intercomparison provides coordinating support and led development of software infrastructure in partnership with the Global Organization for Earth System Science Portals.
Crop Modeling Methodology
For this project, we selected two dynamic crop growth models, the CERES Maize and the CERES Rice model embedded in the Decision Support System for Agrotechnology Transfer (DSSAT) crop modeling framework (Hoogenboom et a. 2010). DSSAT version 4.5 was used. Two types of analyses were conducted—the impact of historical (observed if possible) climate variability on yield, and the impact of projected future climate change on yield. For the historical analysis, precipitation data was used from 17 stations of the Tanzania Meteorological Agency and from CHIRPS for point level modeling, and WorldClim was used in the spatial crop modeling. They were combined with daily temperature and solar radiation data from NASA’s Prediction of Worldwide Energy Resource for the modeling (POWER) (NASA 2014). GCM data was used to examine the impact of projected climate change on yield (climate datasets described above). The soil property data for the historical point-based modeling was obtained from a soils dataset for Africa with a 1 km resolution. It was created by ISRIC World Soil Information based on soil profile and other existing data. The spatial crop modeling was run using data from the FAO soils map calibrated with soil profiles from WISE database (ISRIC).
The rice model was run under rainfed conditions during the rainy season, and irrigated during the dry season. For the simulated rainfed conditions, twenty-day old seedlings were transplanted into plots on November 20th, and the new transplants were provided irrigation water that day. Growth thereafter was rainfed. For the simulated irrigated conditions, seedlings were transplated on June 2nd. The plants were provided irrigation water when soil moisture fell below 50% of plant available soil moisture in top 30 cm of soil profile. Yield is measured in terms of hulled rice. In this Decision Support Tool, modeling results are provided for different management practices:
- Two rice varieties: An older, longer duration and widely grown variety (Supa), and a variety representing a higher producing, improved variety (TXD-85).
- Two fertilizer levels: A low application of Nitrogen fertilizer, of 5 kg/ha, and the higher application of 100 kg/ha.
The maize model was run using the same historical datasets, but AR4 IPCC GCMs (CCSM, HadCM3, ECHam and CSIRO). We assumed current representative smallholder practices; planting was assumed to occur automatically once the soil profile received a thorough wetting at the start of the rainy season (Alagarswamy et al. 2015). In this Decision Support Tool results are provided under different management conditions:
- Two maize varieties: Katumani composite, an older short-season variety developed by the Kenya Agricultural and Livestock Research Organisation (KALRO) for medium- to low- potential zones, and H614, a longer-season hybrid suited for mid- to high-potential zones.
- Two fertilizer levels: low application of Nitrogen fertilizer, of 5 kg/ha, and a moderate application of 85 kg/ha.
- Rainfed and irrigated. Under the rainfed scenario, no additional water was provided so dry conditions could affect yield. Under the irrigated scenario, water was provided as needed.
Hydrology Modeling Methodology
To explore factors related to climate change and water resources, a calibrated model of the Rufiji Basin was created to quantify historical and to project future hydrologic response. The Soil and Water Assessment Tool (SWAT) was used to simulate the hydrology of the entire Rufiji River Basin. Scenarios are based on three time periods: current baseline (1990-2010, calibration), and future 2010-2040 and 2040-2060.
The SWAT model was set up with guidance for agricultural cropping parameters performed with the DSSAT crop models. Input layers into the model included land use, soil type, the digital elevation model and climate.
Current conditions within the watershed were simulated using current land use and agricultural practices, water use conditions and climate. Future projections incorporated data from global climate models and projections of water use, irrigation technology, population and a land use change model. The land use change model projected future land use based on historical urban and rural population growth rates, 1996 and 2013 land use change patterns, and land suitability.
The model used historical climate data from Tanzanian Meteorological Agency as ground truth stations, CHIRPS precipitation data, and NASA POWER-based temperature and solar radiation data. Daily weather data (rainfall, solar and max/min temperature) over the period from 1989 – 2010 was used to drive the model. A weather data file was created for each subbasin. Four GCMs provided future climate projections to support simulations to 2060. Illustrated in this Decision Support Tool are SWAT model results using the MPI-ESM-LR global climate model, as described above.
The Rufiji River Watershed was subdivided into 34 subbasins. We chose 6 river gaging stations from the Rufiji River Basin Authority to use as part of this calibration work. They include the stations (1KA15A, 1KA11A, 1KA32A, 1KA31, 1KA59 and 1KB32). Stage-based gauging stations were combined with the appropriate flow-based rating curves used at each station so that watershed discharge data could be calculated. The daily observed data was aggregated to a monthly average flow value. In turn, the SWAT model was set to output flow values on a monthly value. Additionally, with the exception of station 1KB32, the river gaging station data was located within the Great Ruaha River basin upstream of the Mtera Reservoir. Data within other areas of the watershed such as the Kilombero river or the main branch of the Rufiji River were unavailable to us or their time period did not cover into our modeling period of 1990 – 2010. The model was calibrated using auto-calibration method by linking SWAT with the optimization algorithm, AMALGAM (Vrugt and Robinson, 2007). Auto-calibration was conducted in supercomputer facilities with 24,000 model evaluations.
Irrigation technology scenarios were also examined. Each has an estimated water efficiency rate that affects the availability of water in the local and downstream basins. As efficiency improves, more water is available for additional use. The four irrigation technology levels that are simulated are:
| Scenario | Irrigation Tech. Level | Canals | Water Use Managed | Type of Weeding | Water Returned | Fields Leveled | Flooded vs. Pivot | % Water Use Efficiency |
|---|---|---|---|---|---|---|---|---|
| Baseline Scenario | Current methods | Unlined | No | Hand | No | Poor | Flooded | 15% |
| Scenario 1 | Improved surface | Cement lined, gates | Yes | Hand | No | Poor | Flooded | 30% |
| Scenario 2 | Semi-mechanized | Cement lined, gates | Yes | Herbicide | Some | Moderate | Flooded | 60% |
| Scenario 3 | Mechanized | Central lines / pipes, gates, lined | Yes | Herbicide | Yes, pumped | Good | Pivot | 85% |
References Cited:
Alagarswamy, G., J. Olson, J. Andresen, J. Maitima, N. Moore, B. Mulenga, W. Otim-Nape, P. Thornton, P. Yanda. 2015. The Impact of Climate Change on Water and Nitrogen Deficits for Maize Production in East and Southern Africa. Poster presented at the conference, Transitioning Cereal Systems to Adapt to Climate Change, Nov. 13-14, Minneapolis, MN. http://www.aridcereals.org/posters/Alagarswamy_final.pdf
Funk, C.C., Peterson, P.J., Landsfeld, M.F., Pedreros, D.H., Verdin, J.P., Rowland, J.D., Romero, B.E., Husak, G.J., Michaelsen, J.C., and Verdin, A.P. 2014. A quasi-global precipitation time series for drought monitoring. U.S. Geological Survey Data Series 832, 4 p., http://dx.doi.org/10.3133/ds832.
Hijmans, R.J., S.E. Cameron, J.L. Parra, P.G. Jones, A. Jarvis. 2005. Very high-resolution interpolated climate surfaces for global land areas. International Journal of Climatology 25, 1965–1978.
Jones, P.G. and P.K. Thornton. 2000. MarkSim: Software to generate daily weather data for Latin America and Africa. Agron Journal, 92:445-453.
Moore, N., Alagarswamy, G., Pijanowski, B., Thornton, P., Lofgren, B., Olson, J., Andresen, J., Yanda, P. and Qi, J. 2012. East African food security as influenced by future climate change and land use change at local to regional scales. Climatic Change, 110, 3: 823-844.
NASA (National Aeronautics and Space Administration). 2014. Prediction of Worldwide Energy Resource (POWER). Surface meteorology and Solar Energy. "These data were obtained from the NASA Langley Research Center POWER Project funded through the NASA Earth Science Directorate Applied Science Program." Available from: http://power.larc.nasa.gov/index.php
Olson, J., G. Alagarswamy, J. Andresen, N. Moore, W. Northcott, P. Miller, C. Hawkins, D. Pike and P. Morse. 2015. Analysis of the Impact of Climate Change on Crop and Water Availability, and Consideration of Potential Adaptation Practices for the Rufiji River Basin, Tanzania. Technical report submitted by Michigan State University to the University of Dar es Salaam for: "The Rice and Maize Resilience to Climate Change in the Rufiji Basin Project," 15 October. 96 pp.
Otieno, V. O., & Anyah, R. O. 2013. CMIP5 simulated climate conditions of the Greater Horn of Africa (GHA). Part 1: Contemporary Climate. Climate dynamics, 41(7-8), 2081-2097.
Vrugt, J.A. and Robinson, B.A. 2007. Treatment of uncertainty using ensemble methods: Comparison of sequential data assimilation and Bayesian model averaging. Water Resources Research 43: doi: 10.1029/2005WR004838. issn: 0043-1397.