Climate and Minimum Temperature
Introduction
The Rufiji Basin has a wide range of temperatures, from extremely warm in the lowlands near the coast, to cold temperatures in the Rubeho Mountains, Iringa Highlands, Mbarika Mountains and Kipengere Range (thereafter referred to as the Highlands). The plains north of the Iringa Highlands are somewhat cooler than those south of the Highlands, where even minimum temperatures average over 25°C.
Most rice varieties, including those grown in Rufiji Basin, thrive in warm climates and do not produce in cooler temperatures. Temperatures below 25°C will slow the reproductive processes, and minimum temperatures below 18°C will generally cause sterility. Under these conditions, rice is restricted to lower elevation areas in the Basin.
Maize does best under moderate temperatures, and its temperature range is greater than for rice. It has a higher ability to withstand cooler temperatures. Optimum minimum temperatures are 21°C to 27°C. Minimum temperatures below 10°C affect maize at all stages, reducing germination and delaying and reducing grain harvest. Maize can thus grow in higher elevation zones than rice. In the lowlands, however, very warm maximum temperatures lead to higher respiration. Warmer temperatures reduce maize yield while increasing its water demand.
Current Minimum Temperature
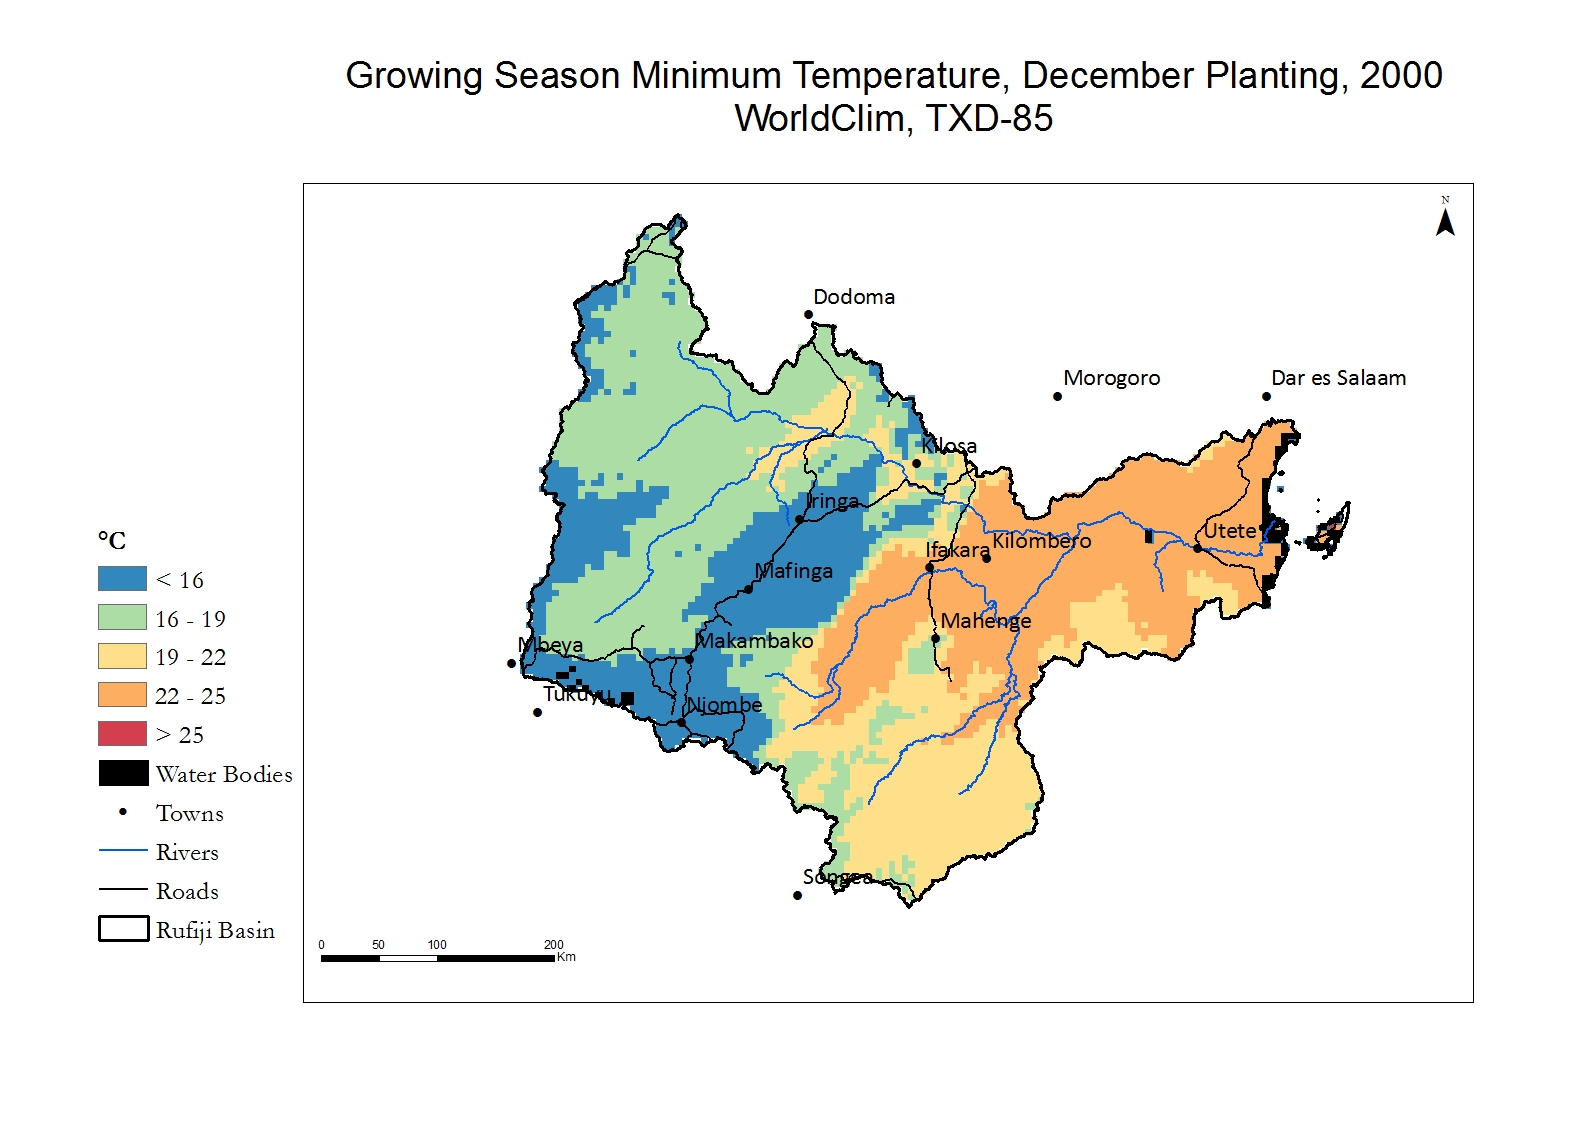
The current minimum temperatures range from below 16°C. in the Highlands to around 24°C. in the lowlands towards the Indian Ocean coast. Maize and rice are thus currently limited to areas outside of the coldest blue zones.
The maps focus on the temperature during the growing, or rainy season months from December to April.
Future Minimum Temperature - 2050
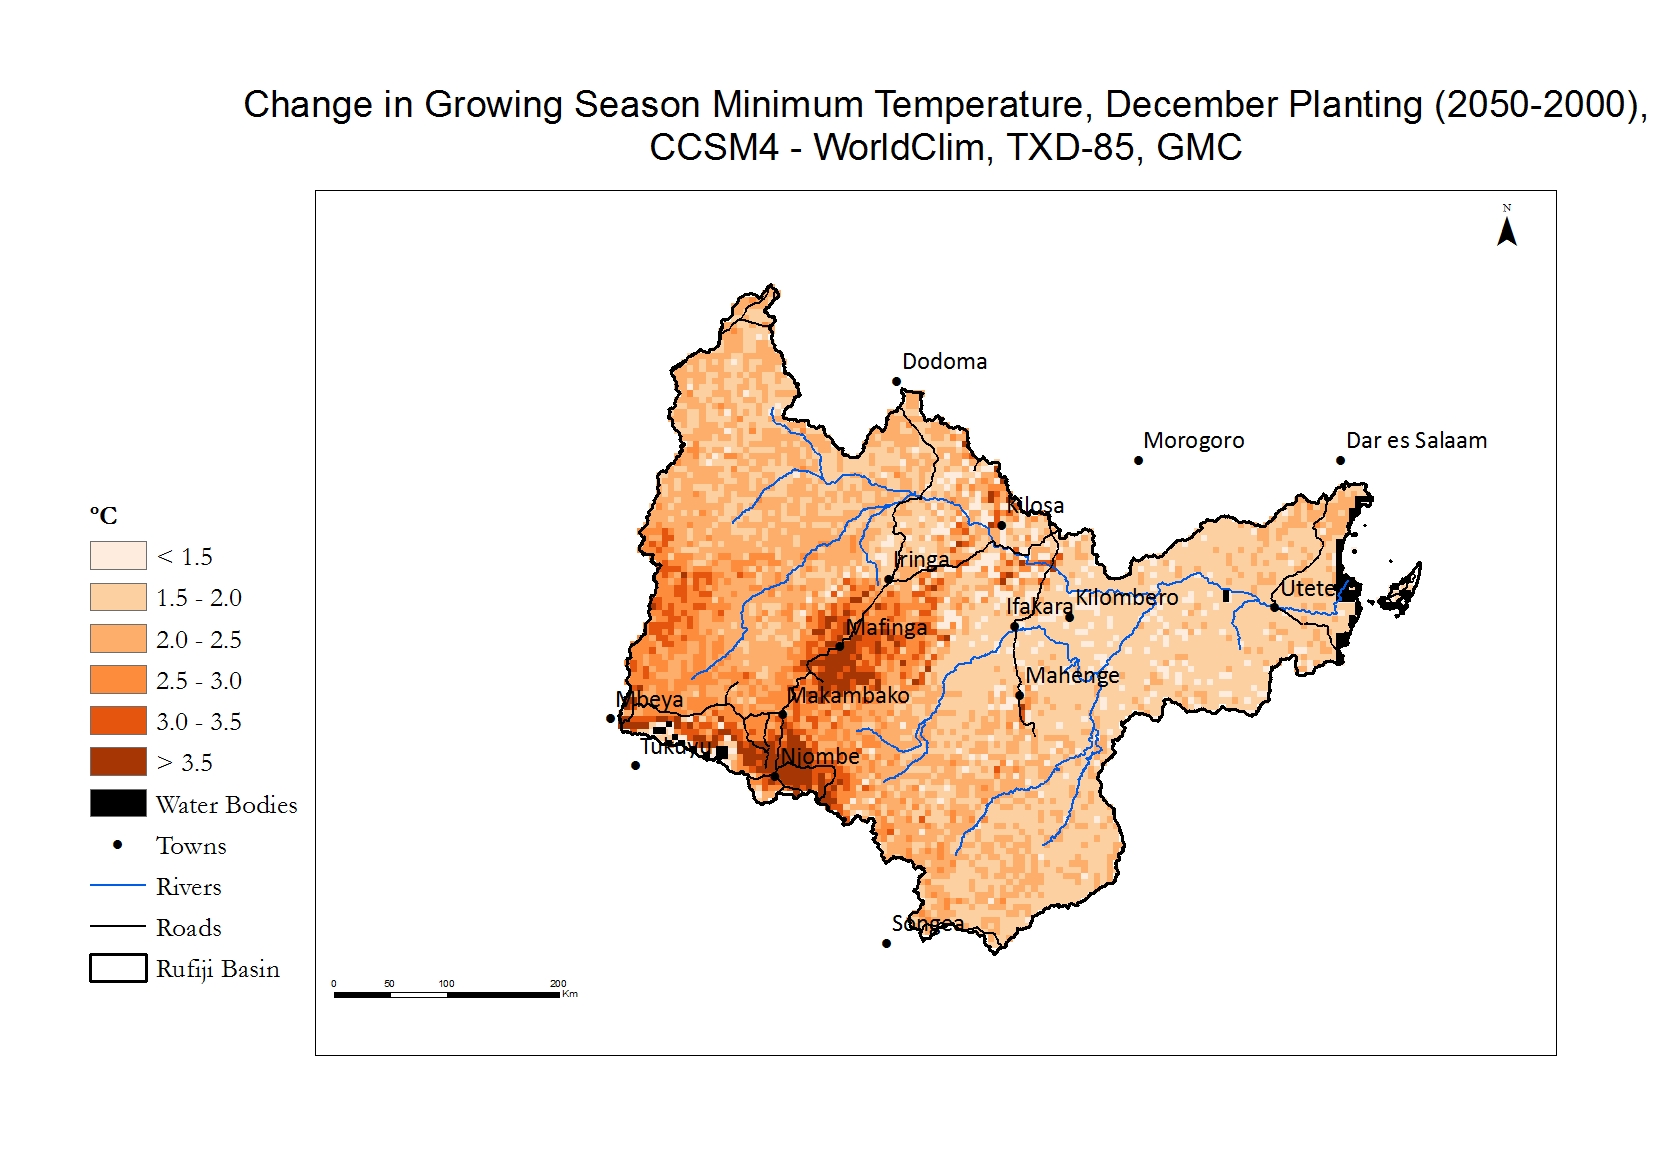
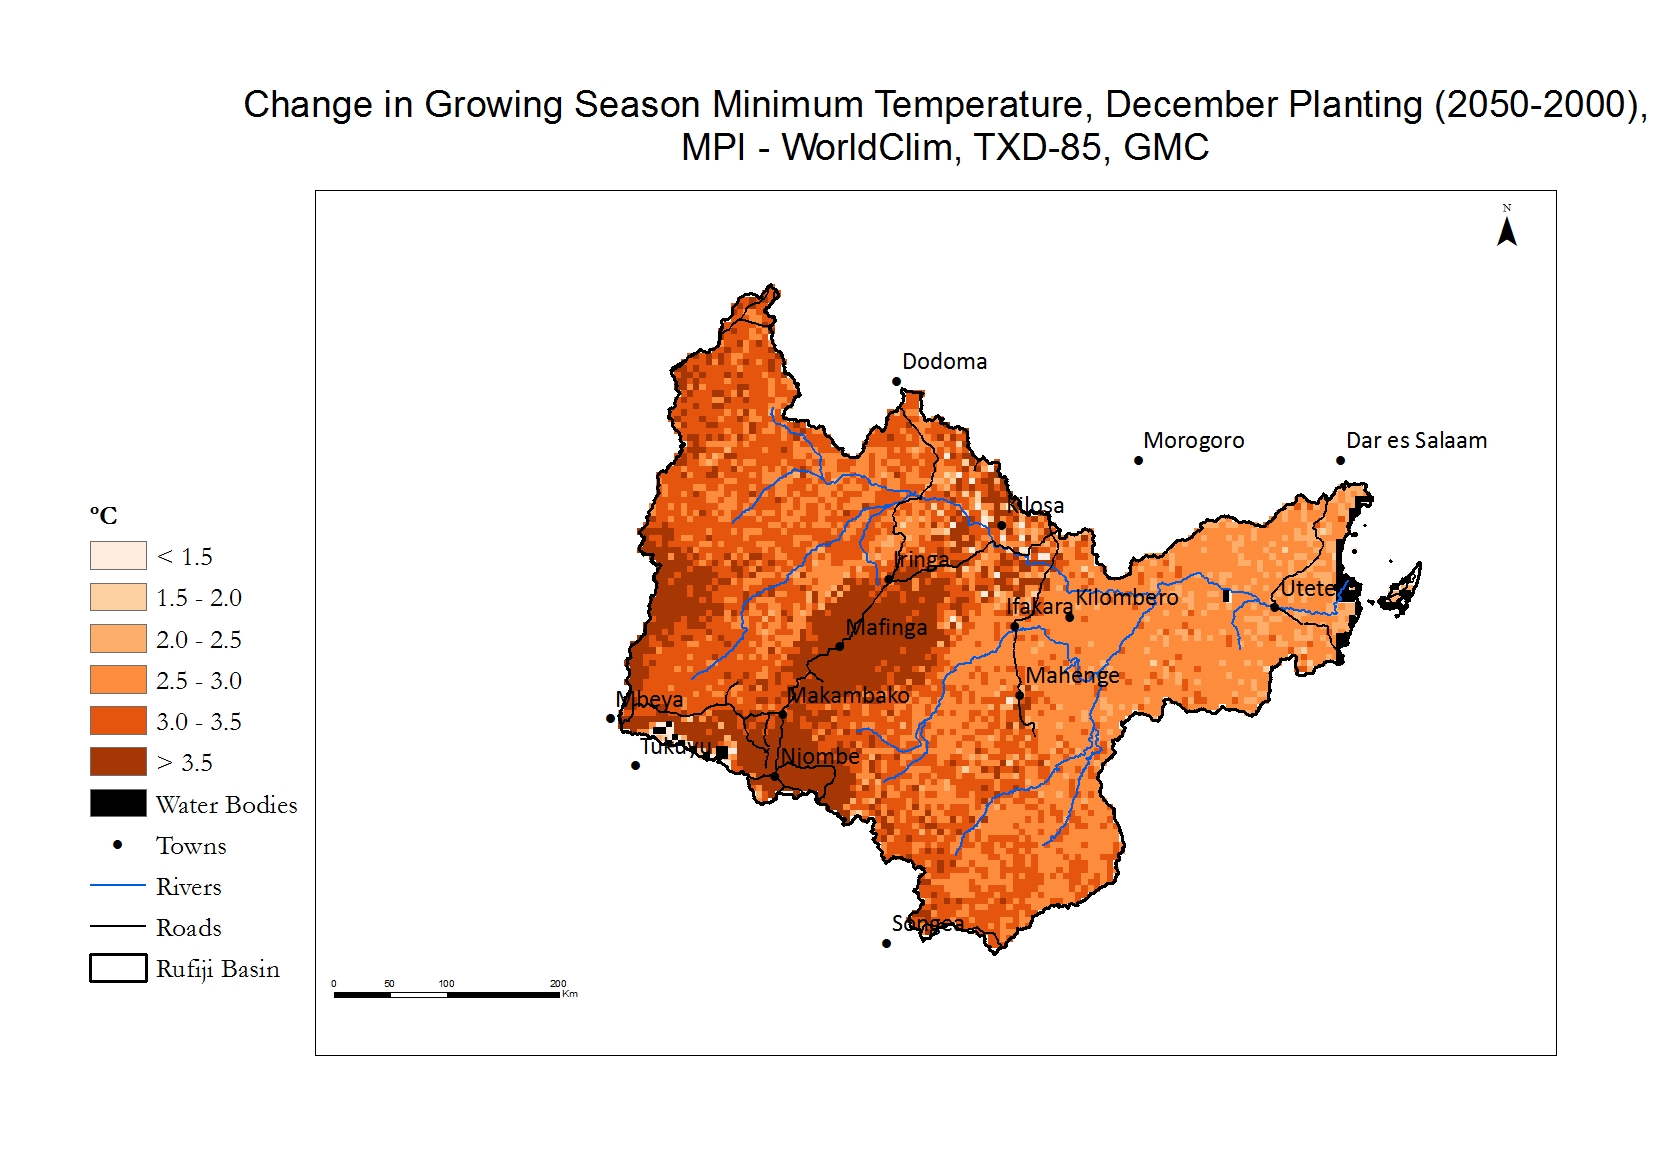
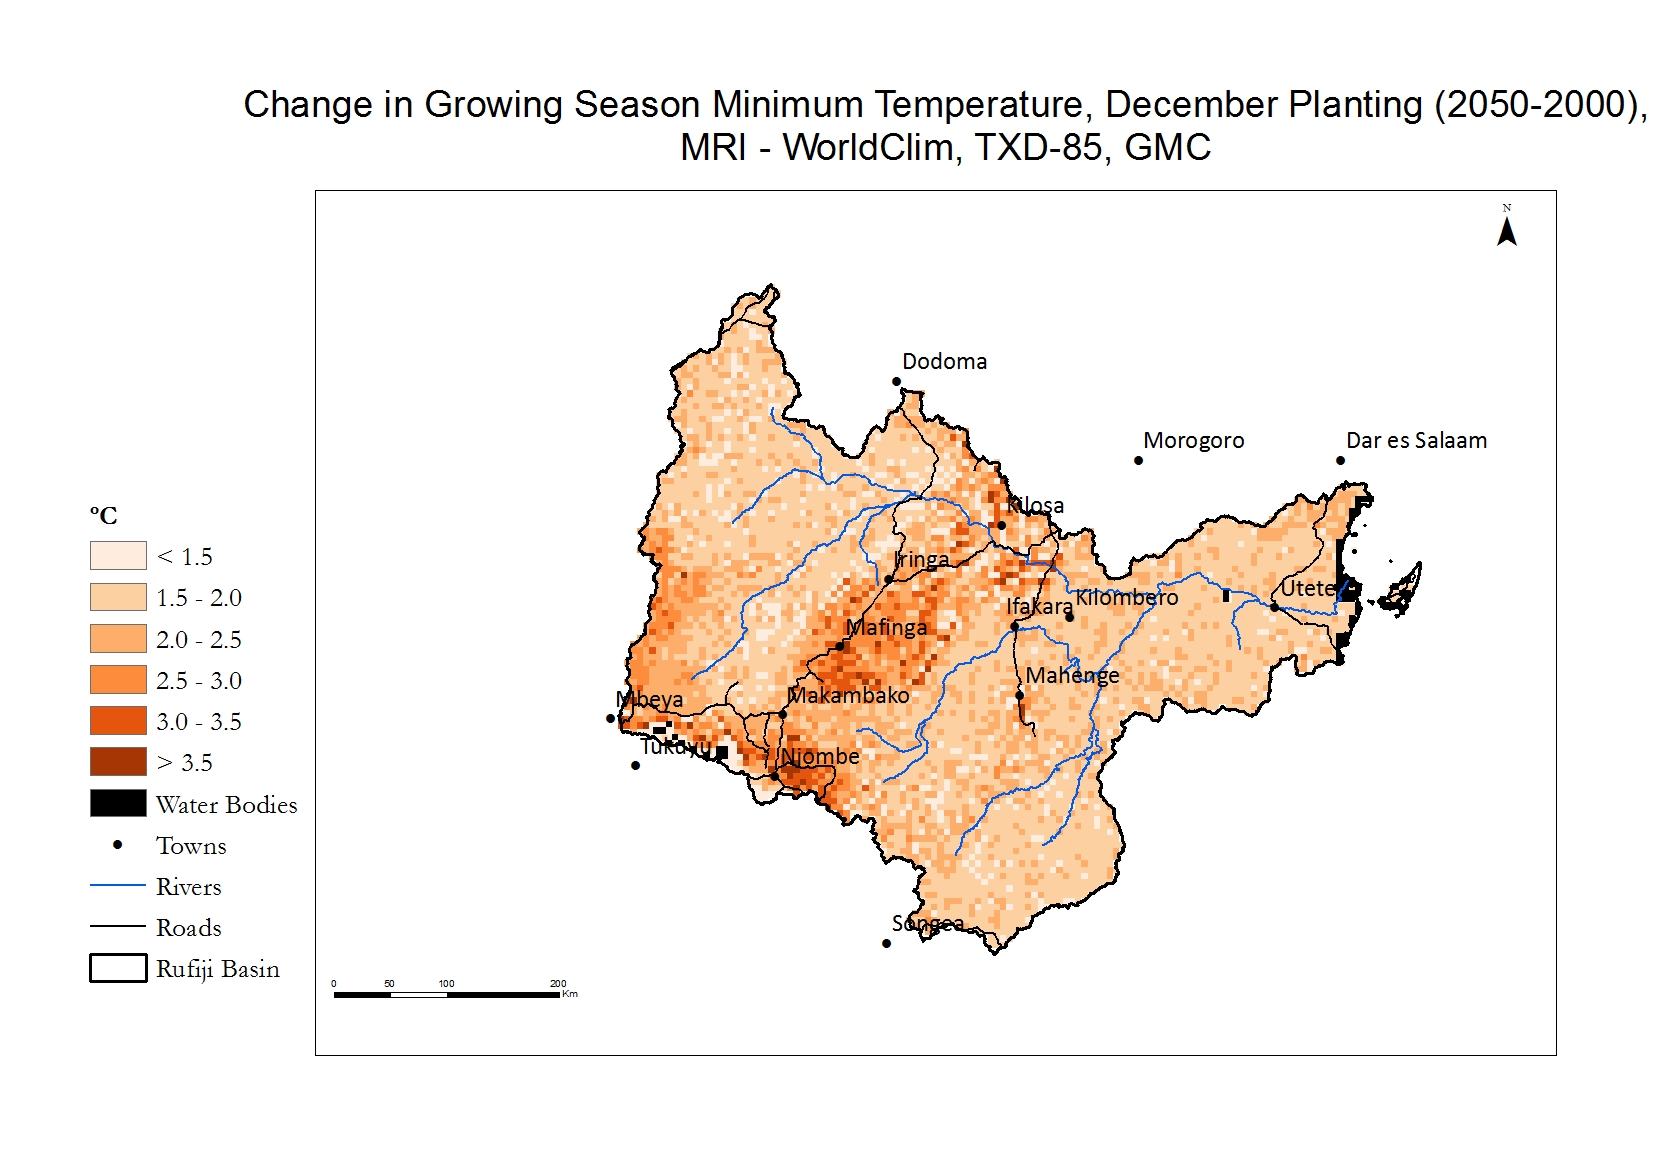
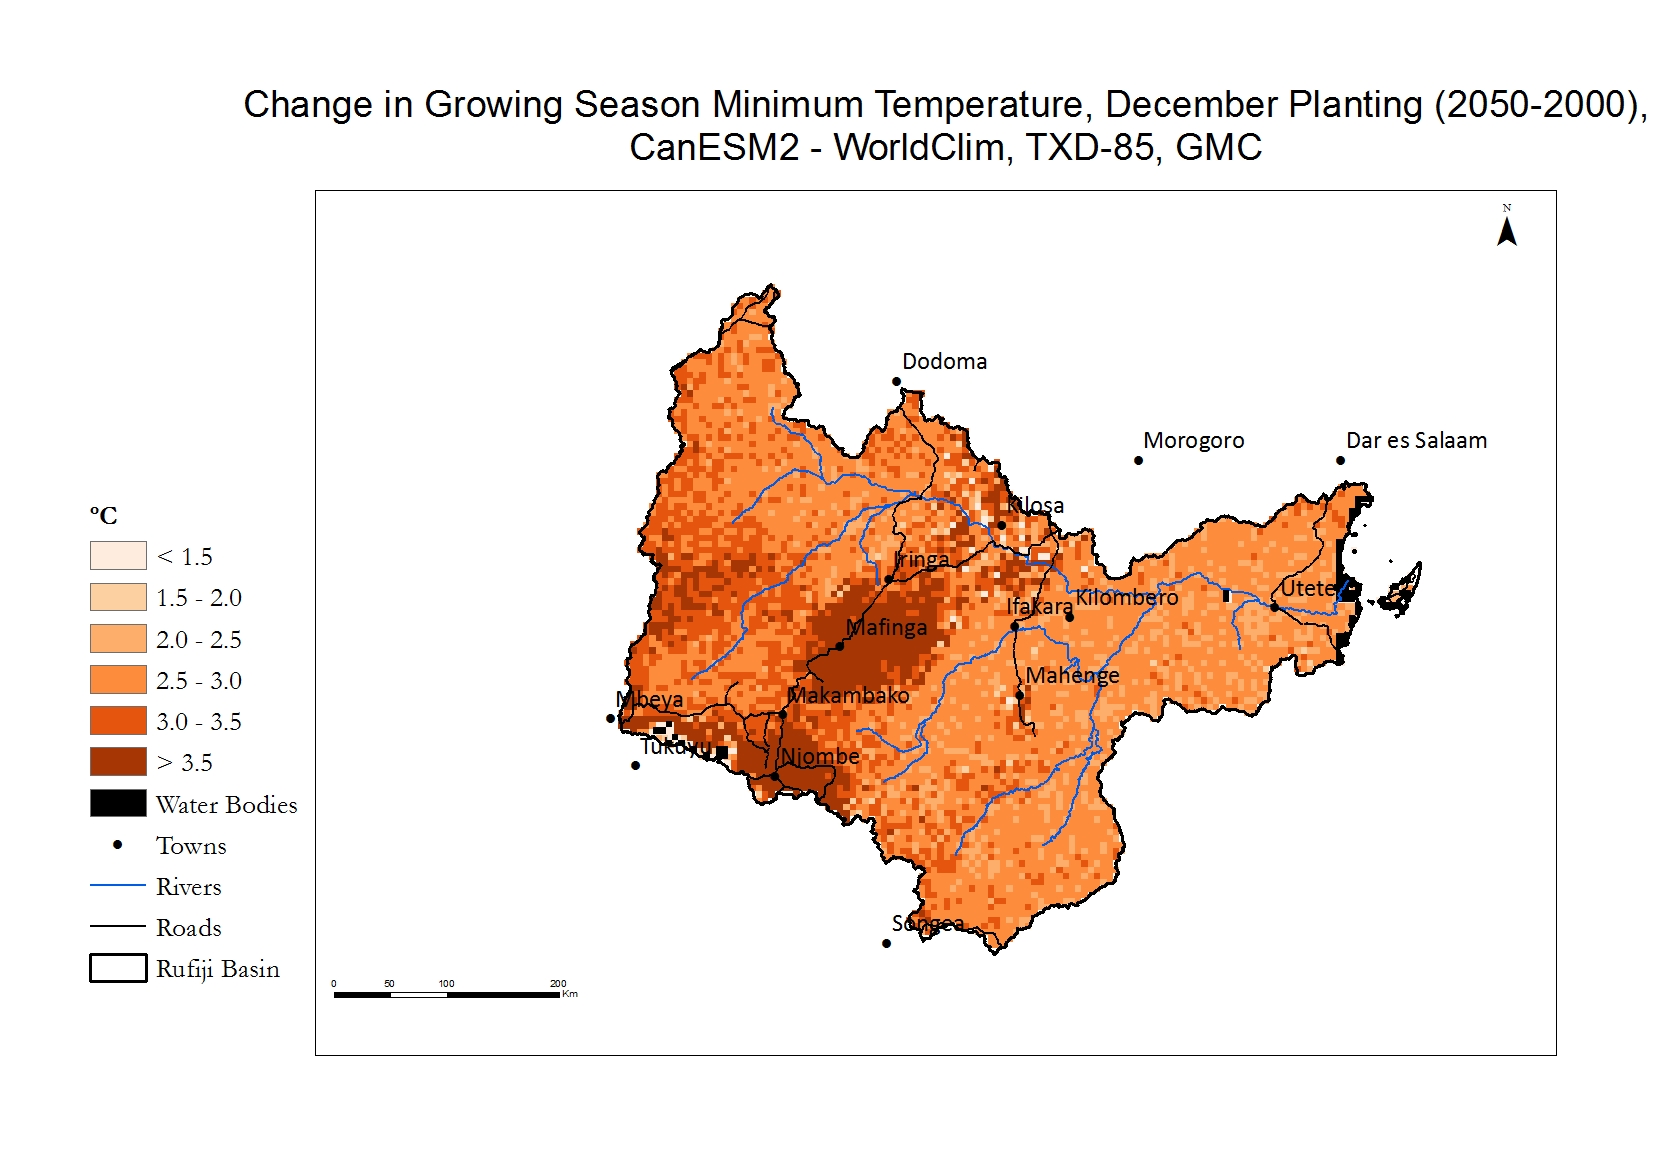
Climate change is already raising temperatures in the Rufiji Basin. All selected GCMs project an increase of an additional 1.5 to 3.5°C or higher, depending on location in the Basin and GCM. Generally, the minimum temperatures are rising faster than the maximum temperatures.
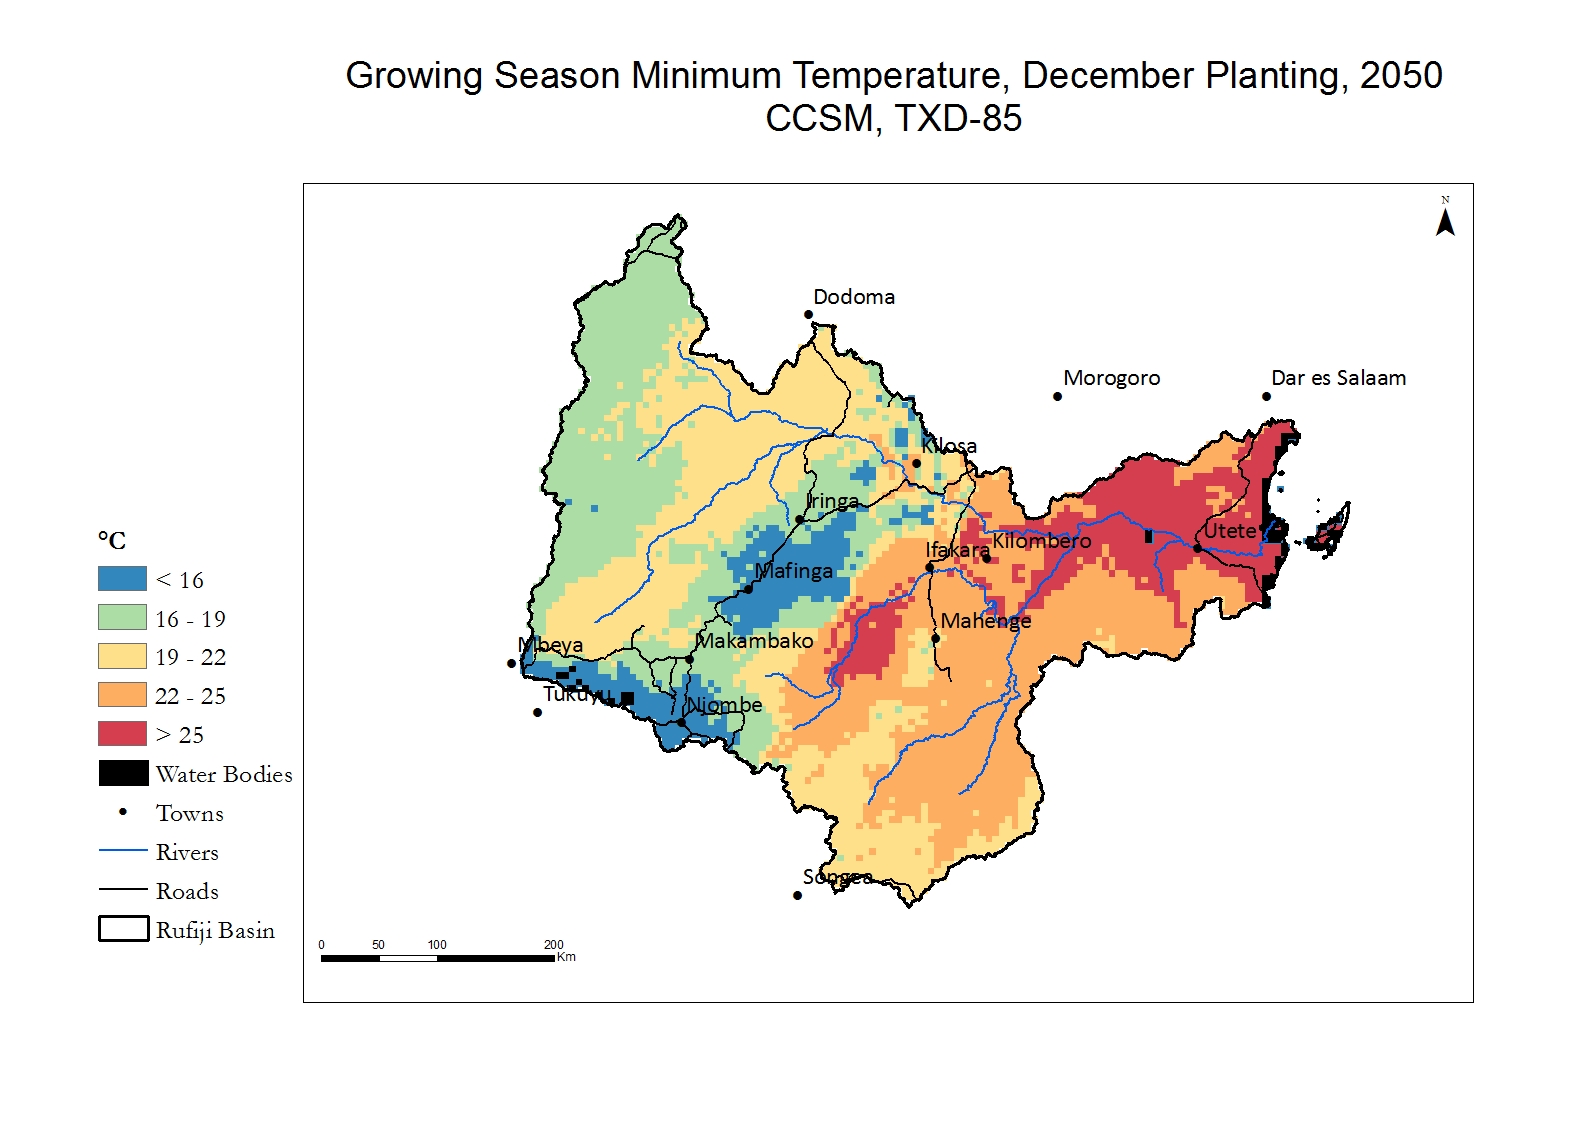
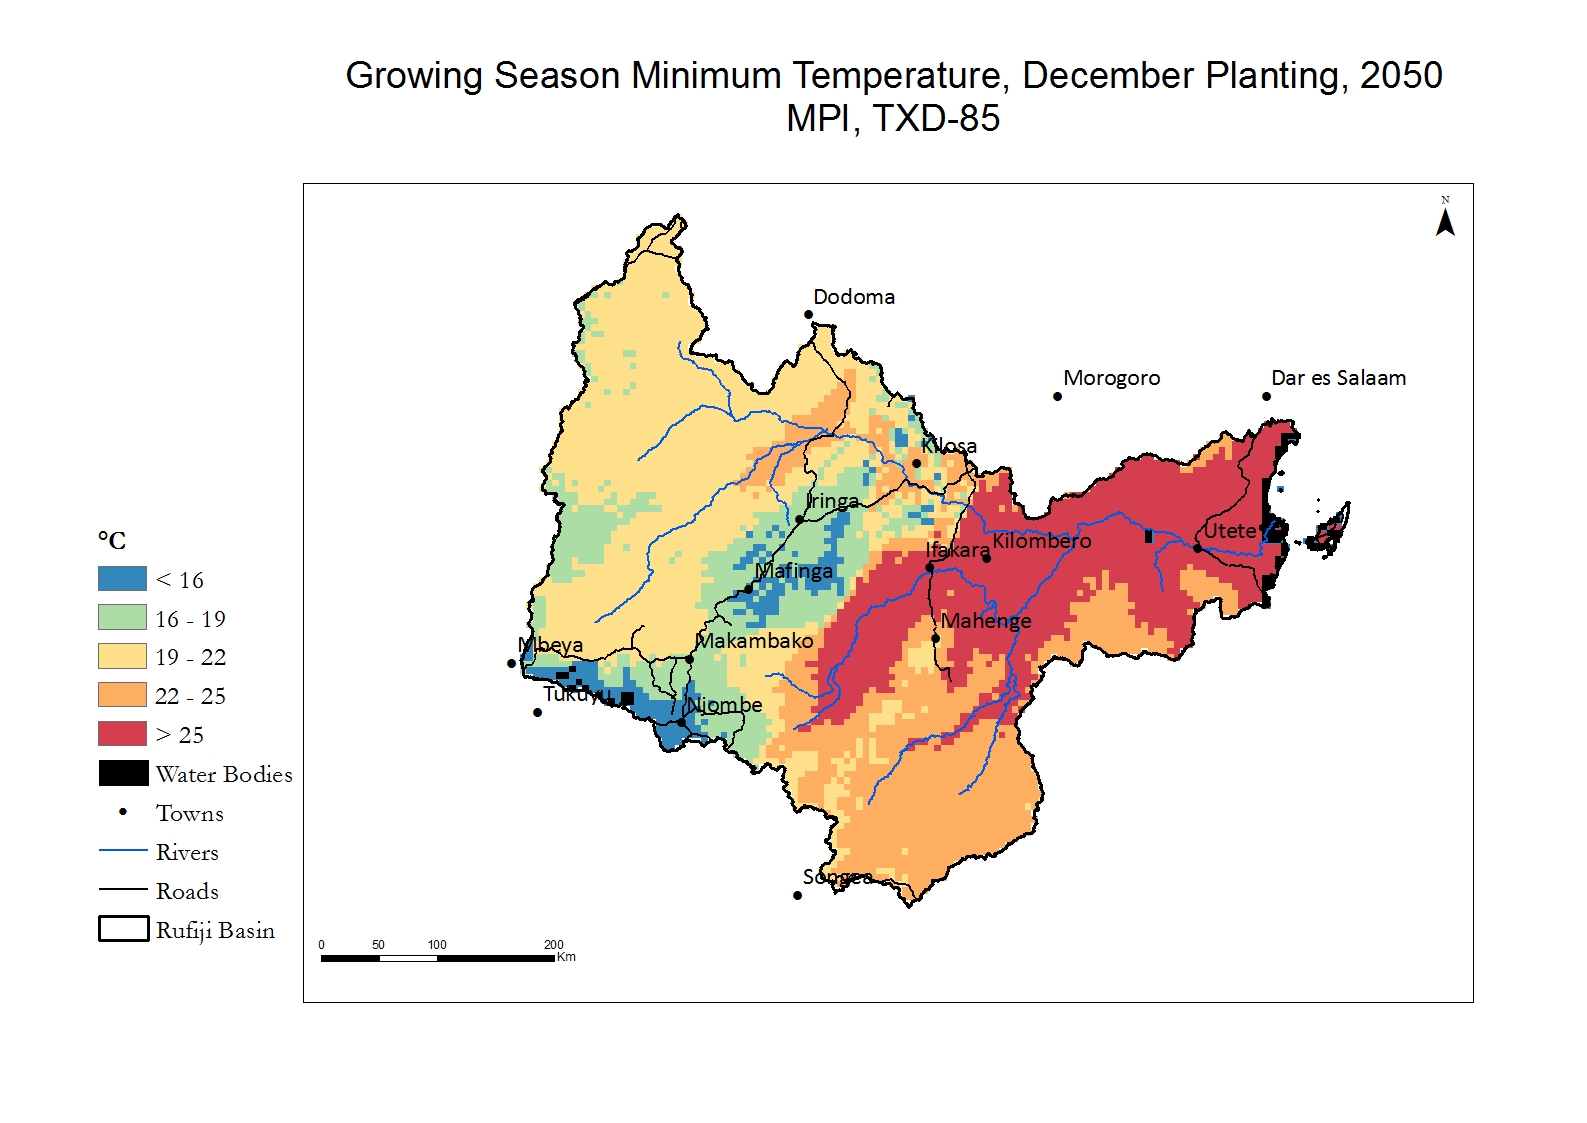
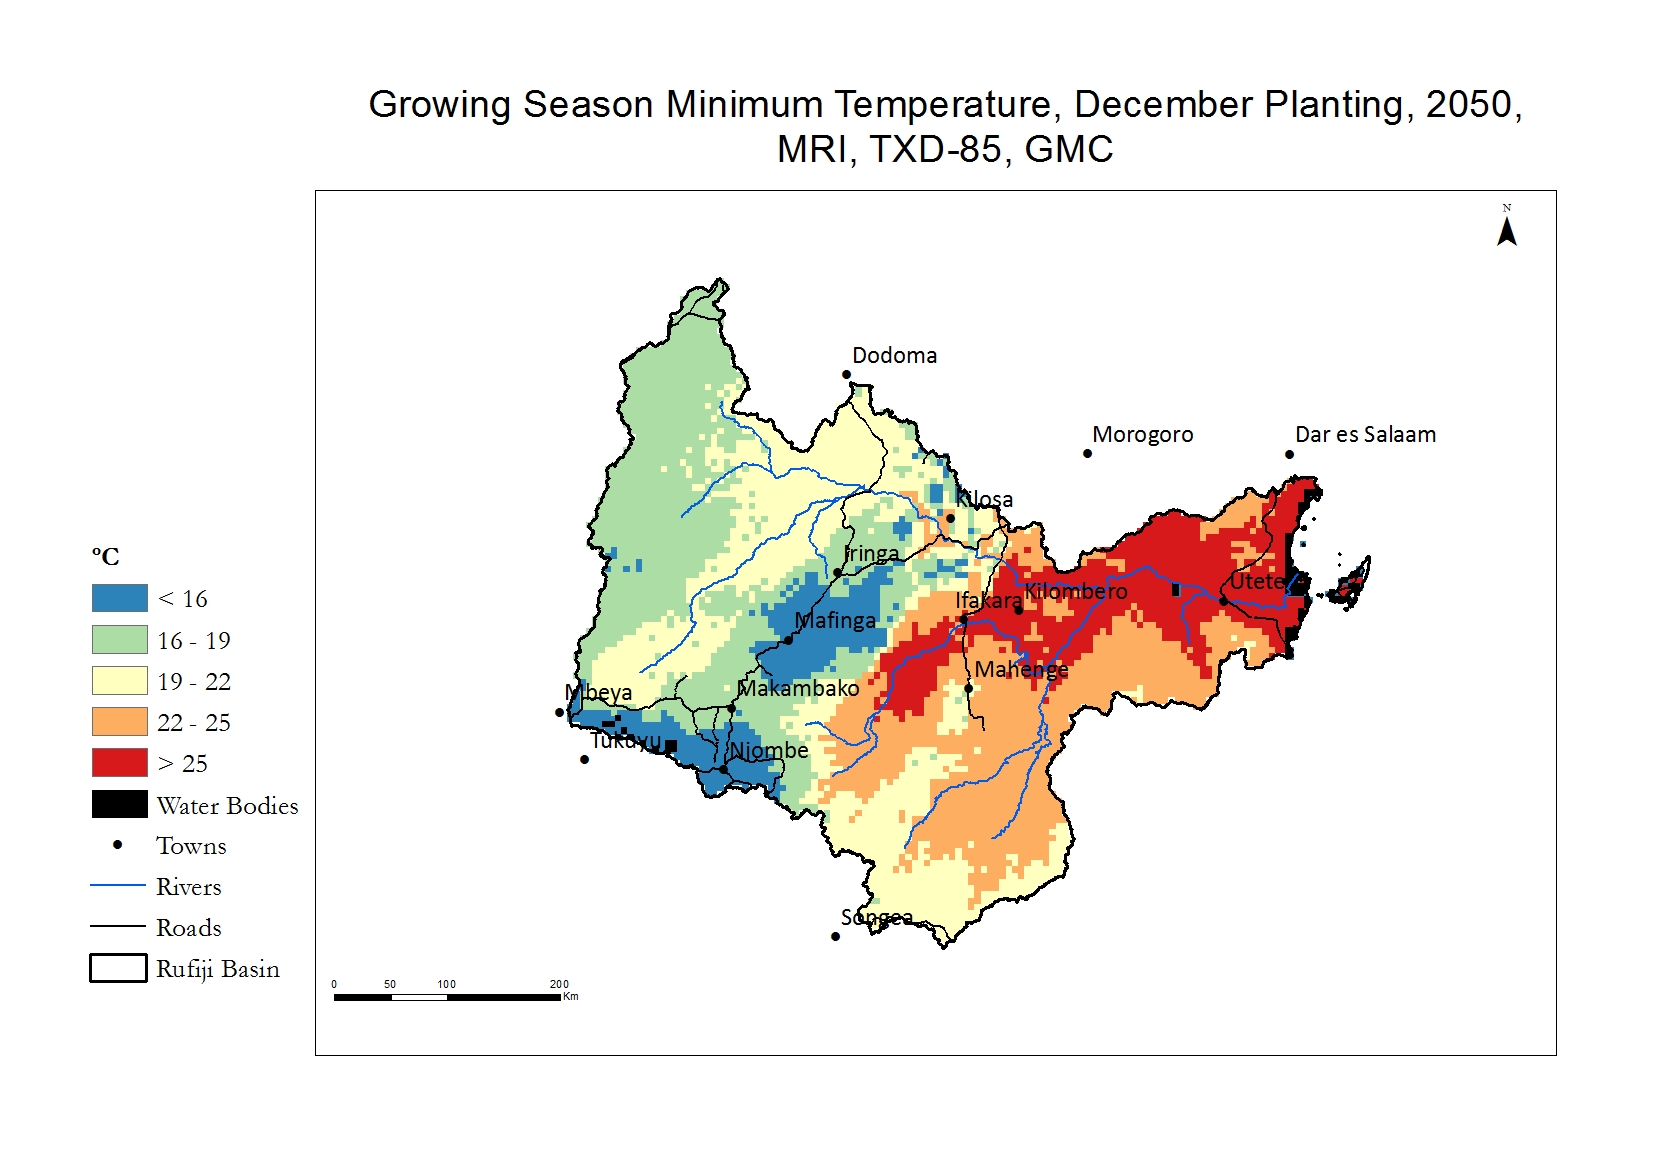
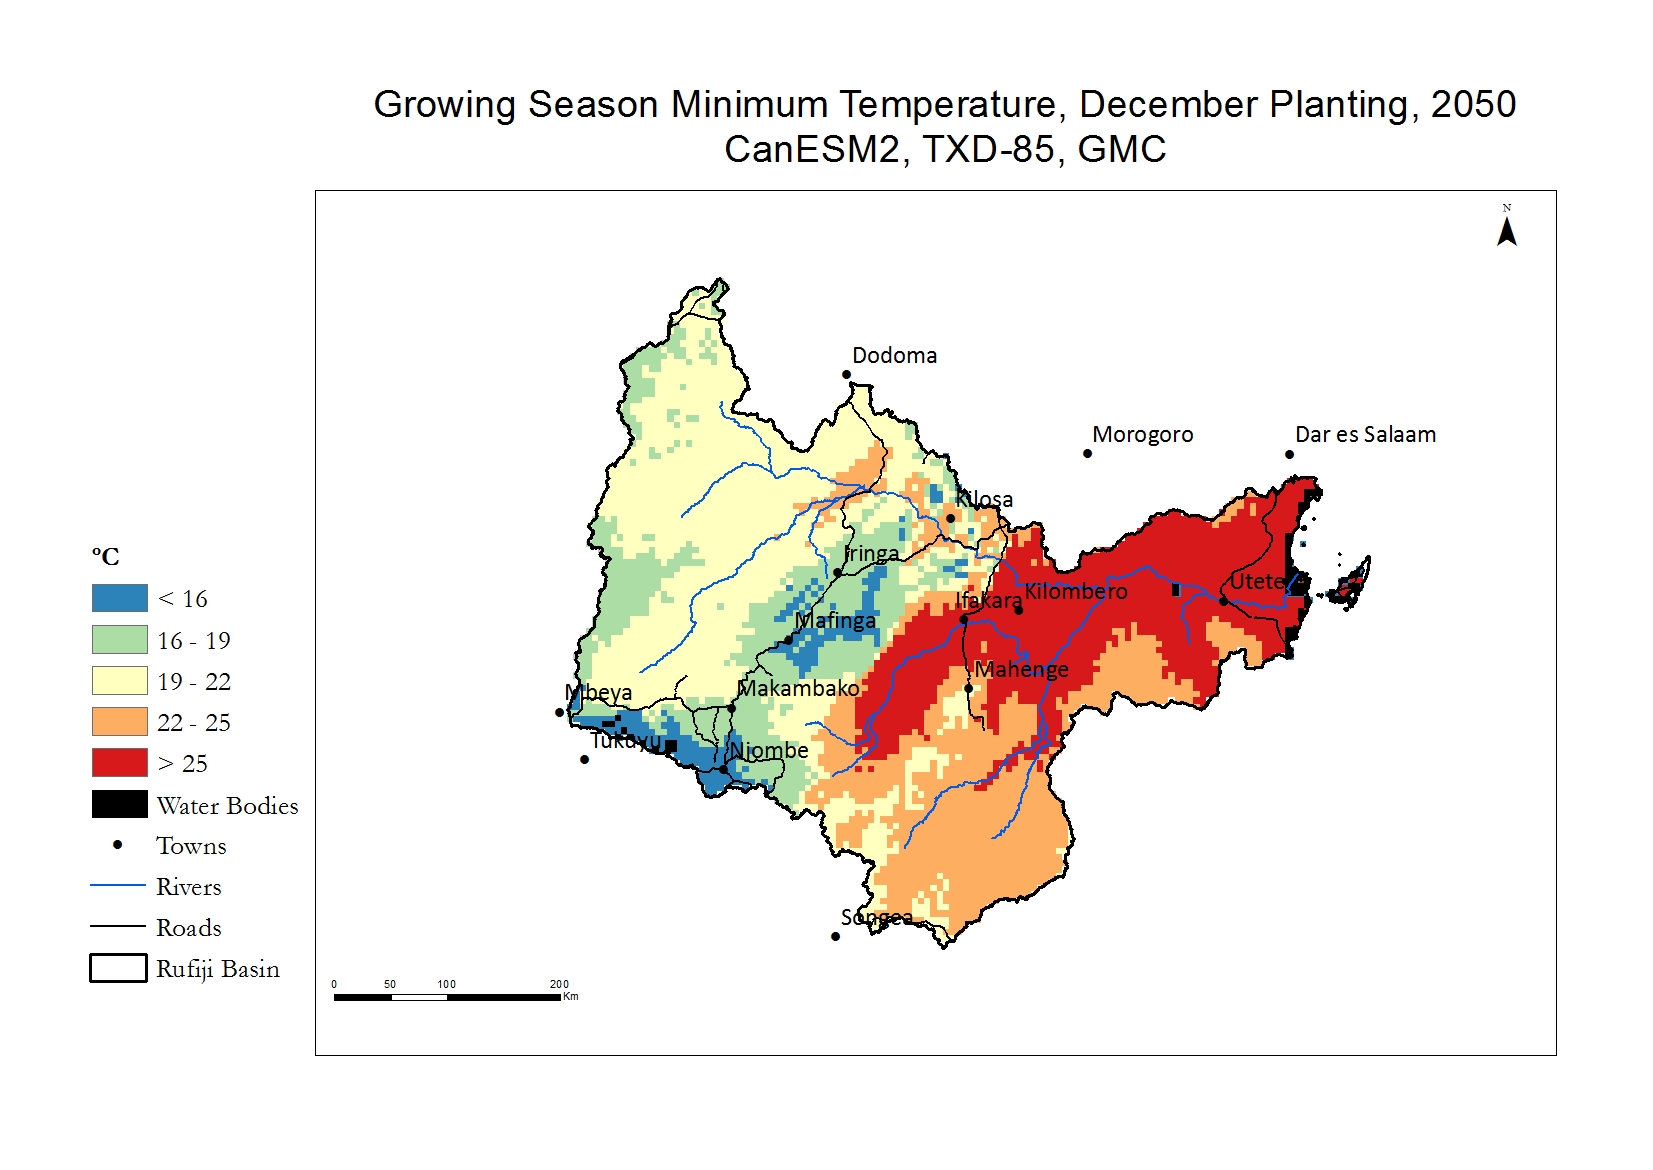
The maps below illustrate the projected minimum temperature in 2050 according to four global climate models (GCMs). The results of four GCMs are provided to illustrate the range of projected changes in temperature; this is common practice in climate change science due to the inherent uncertainty of modeling future climate. Although the four GCMs were chosen for their ability to simulate current trends in East Africa, it is not possible to judge their accuracy in projecting the future. Note that the future climate and other projections are thus not certain and please take the results as representative trends. All four GCMs do show a strong warming trend of minimum temperate, with MPI and CanESM2 being the warmest. CCSM4 and MRI also project warming, but not as rapidly.
The size of the coldest zone, illustrated in blue, shrinks considerably in all four GCMs, meaning that the area too cold for maize and rice will shrink and more of the Highlands will be warm enough to grow maize and rice. However, the minimum temperature also gets considerably warmer in the areas already warm such as in the lowlands nearer the coast, and in the future that area may be too warm for maize because it requires cool night-time temperatures.
Change in Minimum Temperature
The maps below indicate the change in the minimum temperature expected between around 2000 and 2050, in terms of number of degrees. The darker the color, the more change is expected. In general, the Highlands are expected to warm faster than the lowlands. They will still remain cooler than the lowlands, but their night-time temperature is expected to get rapidly warmer.
All four GCMs indicate that the night-time temperatures are going to get much warmer, between 1.5° and 3.5° F warmer than currently. The MPI and CanESM2 models show more rapid warming than the other two models.
With the projected warming in the future, minimum temperatures in the Highlands will increase and the area too cold for rice under current conditions will shrink. Even if rice can be grown there, however, the length of the growing season will remain very long, over 160 days, and yields low. The area under maize, however, can potentially increase substantially in the Highlands, but at the expense of cooler temperature crops such as coffee.
Comparison
These maps have a slider. When you move the large red dot left and right, you can compare the 2000 and the 2050 minimum temperatures. For example, you can see how the coldest zone, in blue shrinks as the temperature in the Highlands warms. You can also see how the warmest zone expands as temperatures rise.
The 2000 map is labeled "WorldClim", which is the dataset representing current temperatures. The 2050 maps are labeled with the specific GCM names.
 Current
 Current
 Current
 Current
