Climate Effects
Introduction
Rice is vulnerable to climate change because of its high demand for water, and sensitivity to cool temperatures and extreme heat. It also requires sufficient nutrients to produce well, and it is very responsive to supplemental fertilizers. In the Rufiji Basin, much rice is grown using rainfed conditions during the rainy season (the “December Planting”) during which the distribution and amount of rain during the season greatly affects yield. Areas where irrigation can be practiced also grow rice during the dry, winter season (the “June Planting”). Climate affects irrigated rice, as well, as temperatures vary.
Current
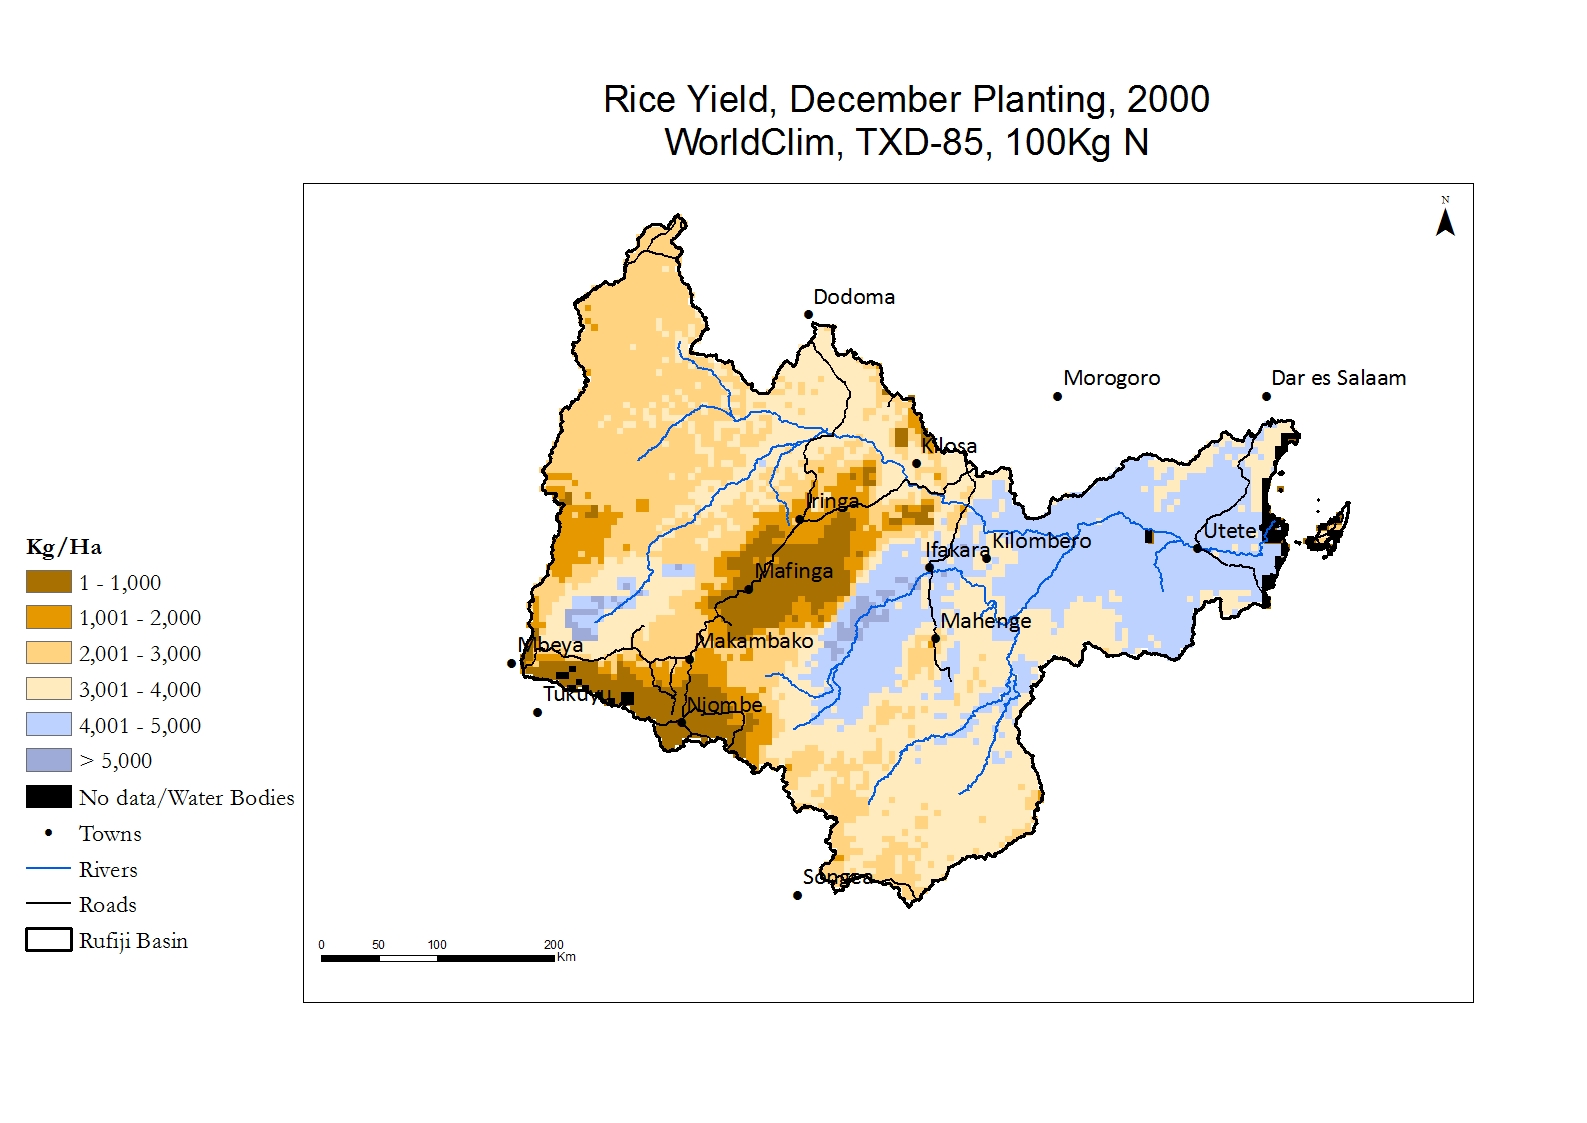
Rice yields vary greatly across the Basin, with the highest yields in the warmest, sub-humid zones east of the Highlands. These areas have very good conditions for rice with their warm temperatures and sufficient precipitation. Simulated yields in some locations are over 5,000 kg/ha (note: on-farm yields rarely attain these types of simulated yields because simulations do not reflect plant disease, lower nutrient levels, pest, weeds, etc.). Yields are lower in the western plains and especially the Highlands, where cool temperatures restrict yield.
Future - 2050
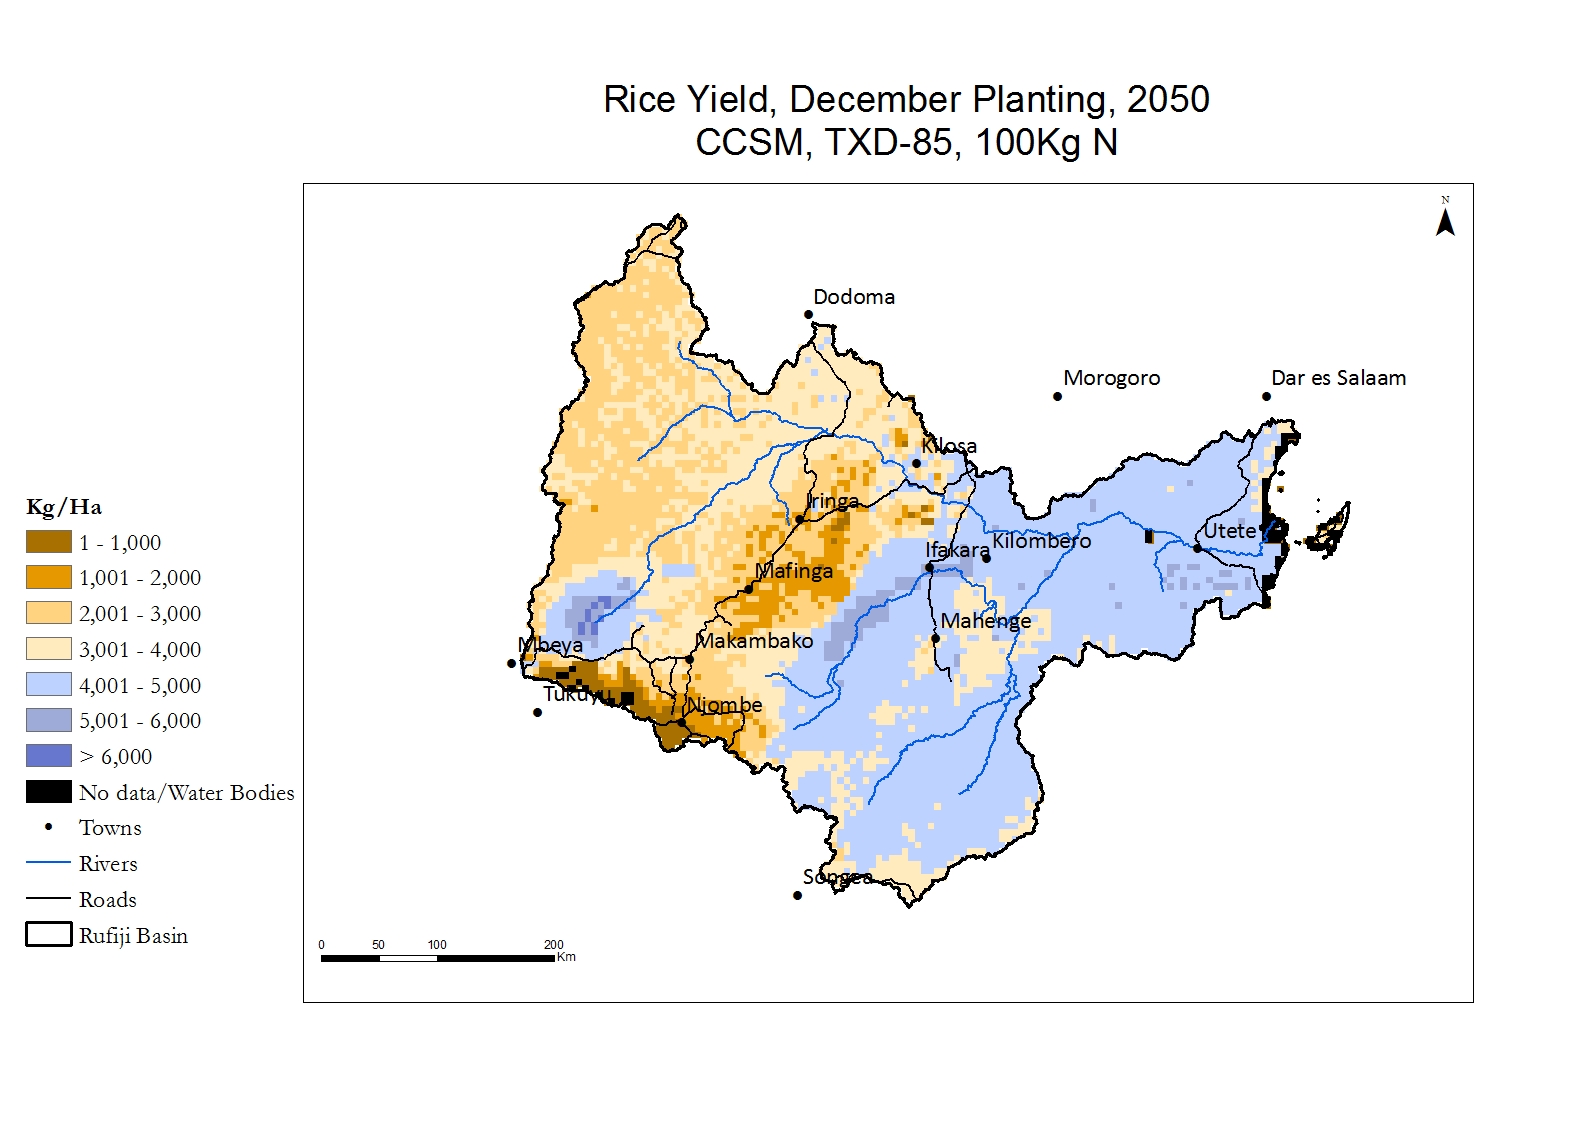
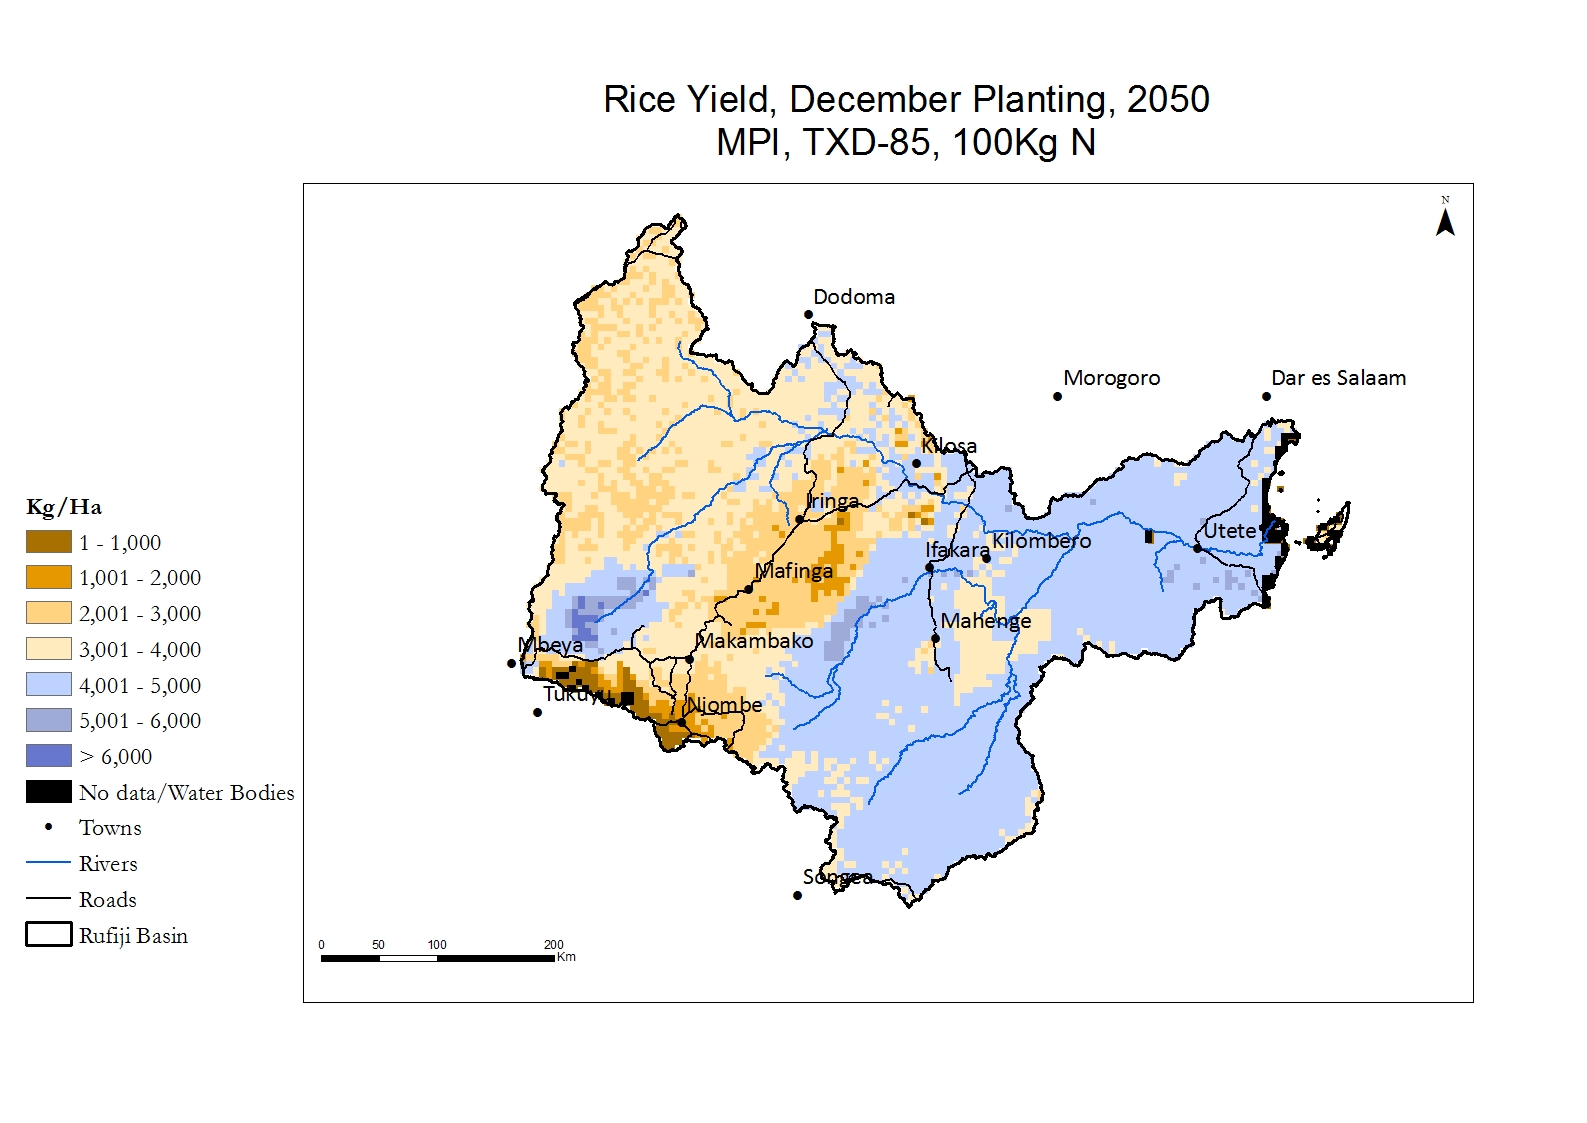
The geographic pattern of rice yields in the future shows highest yields would remain in the warm, wetter areas to the east of the Highlands remains in the future. The two GCMs have little difference in yield.
Change
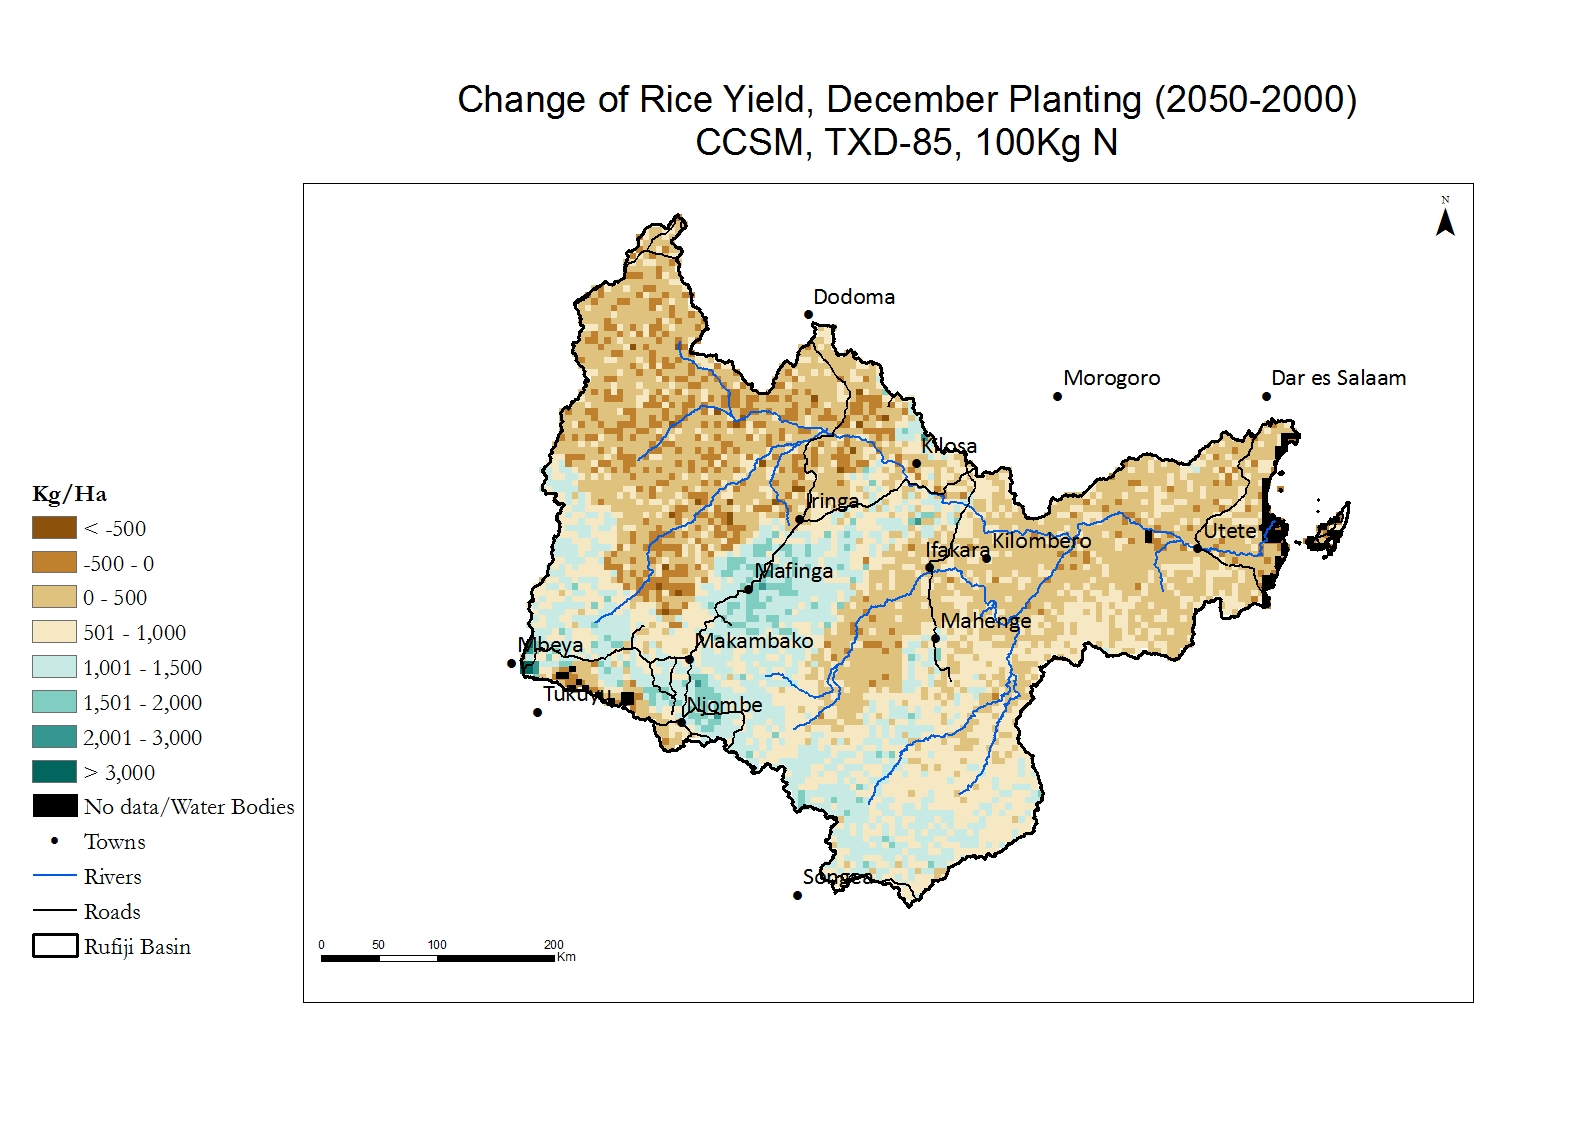
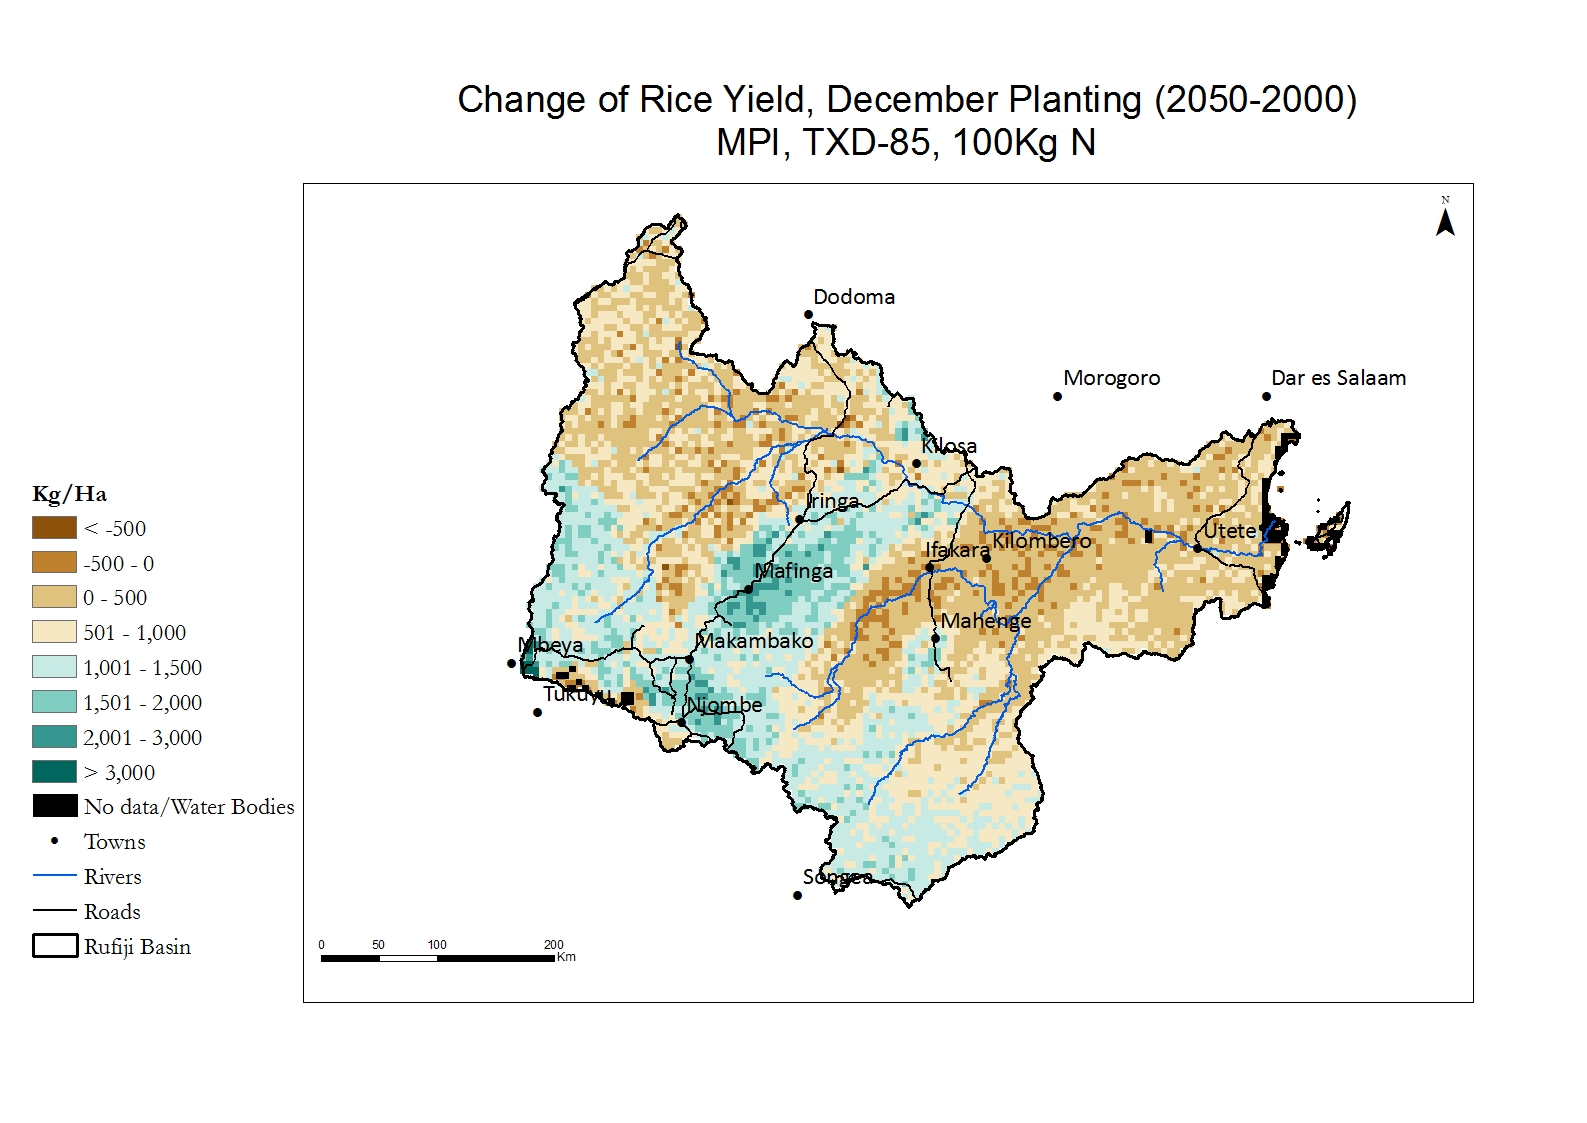
It would be expected that rice would do better in the future due to the rising temperatures. However, the lowland warm zones are projected to have little change or somewhat declining rice yields by 2050 due to the higher demand for water, and little change in precipitation to provide that water. Extreme high temperatures will also reduce yields. The cool Highlands, however, are projected to have an increase in rice yields as temperatures moderate, but yields in the Highlands will remain substantially lower than in the lowlands. Rice production may be able to be move somewhat up the elevation gradient, however.
Comparison
These maps have a slider. When you move the large red dot left and right, you can compare rice yields in 2000 (called WorldClim) and 2050 (called by the name of the GCM). For example, you can see how the area with the lowest yield, in blue shrinks as the temperature in the Highlands warms. You can also see how the yield in the warmest zone in the east declines as temperatures rise too high for rice.
 Current
 Current
